
Adding Integers Using a T-Chart: A Clear, Step-by-Step Strategy for Students
Learning how to add integers is a key skill in middle school math, especially as students prepare for pre-algebra and algebra. Positive and negative numbers can look intimidating at first, but using a simple and visual strategy—like a T-chart—helps students understand integer addition with clarity and confidence. A T-chart separates positive numbers and negative numbers into two clear columns, making it easy to see how they combine. This structured approach transforms a tricky topic into a step-by-step process that students can follow every time.
Whether you are a teacher introducing integers for the first time, or a parent helping your child with homework, the T-chart method provides a clean, logical way to break down problems. It helps students visualize what is happening with positive and negative values, avoid sign confusion, and build long-term confidence in integer operations. In this article, we dive deep into what a T-chart is, why it works, and how to use it effectively with real examples.
What Is a T-Chart for Integer Addition?
A T-chart is a simple diagram shaped like the letter “T.” The left side is used for one category, and the right side for another. When adding integers, the T-chart becomes a tool to separate:
- Positive integers (values greater than 0)
- Negative integers (values less than 0)
Instead of mixing signs and trying to mentally track positives and negatives, the T-chart organizes them visually. This helps students avoid common mistakes such as combining signs incorrectly or adding absolute values without considering direction.
Why the T-Chart Method Works So Well
Adding integers is ultimately about understanding two things: direction (positive or negative) and distance from zero. Many students struggle because they try to solve problems too abstractly. The T-chart:
- Creates a visual separation between positive and negative values
- Simplifies the steps required to find the sum
- Helps students compare the strengths (absolute values) of numbers
- Reduces stress and confusion around rules like “same signs add, opposite signs subtract”
- Makes integer addition feel more like sorting than solving
With enough practice, students who use T-charts begin to internalize integer rules naturally, without needing to memorize them through repetition.
How to Add Integers Using a T-Chart
Here’s a clear, step-by-step process students can follow for any integer addition problem:
- Draw a large T-shaped chart. Label the left column “Positive Numbers” and the right column “Negative Numbers.”
- Sort each integer into its correct column. All positive numbers go on the left, negative numbers go on the right.
- Add all positive values together. This gives you the total positive strength.
- Add all negative values together. This gives the total negative strength (ignore the negative sign until the end).
- Compare which side is stronger. The bigger absolute value determines the final sign.
- Subtract the smaller total from the larger total. Apply the sign of the stronger side.
This structured approach helps students understand not just the answer, but why the answer makes sense.
Example 1: Adding Integers with the Same Sign
Problem: 7 + 5
This example has two positive numbers. Watch how simple the T-chart becomes:
- Positive column: 7, 5
- Negative column: — (empty)
Add positives: 7 + 5 = 12 Add negatives: none Stronger side: positive Final answer: +12
Students easily see that numbers on one side simply combine, reinforcing the idea that adding integers with the same sign is straightforward.
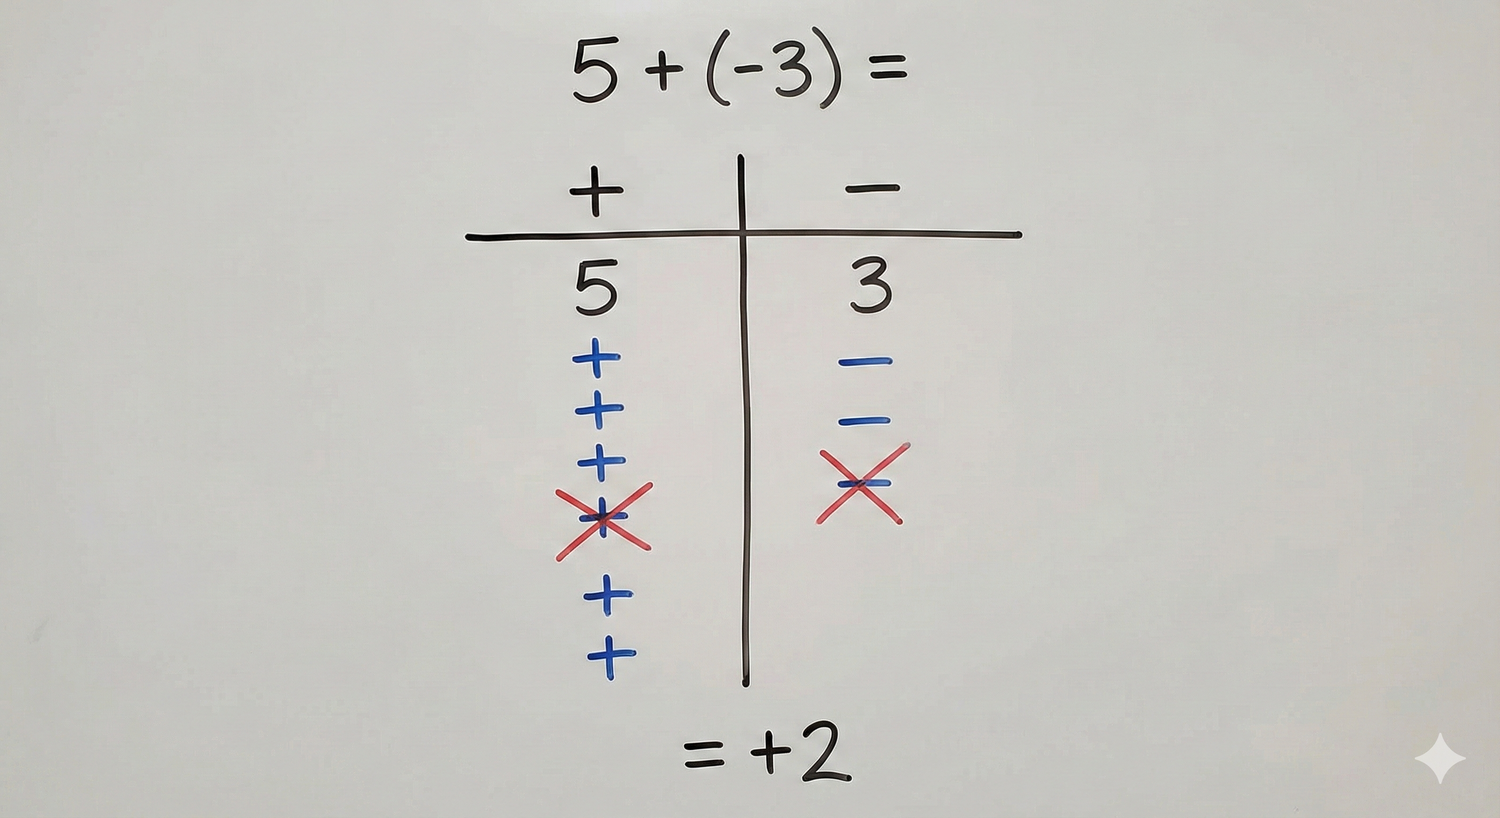
Example 2: Adding Integers with Opposite Signs
Problem: 9 + (–13)
- Positive column: 9
- Negative column: –13
Add positive side: 9 Add negative side: 13 Stronger side: negative (because 13 > 9) Subtract: 13 – 9 = 4 Apply sign: –4
This example demonstrates one of the biggest benefits of a T-chart: students can visually compare the “strength” of positives and negatives. The bigger side wins.
Example 3: Adding Multiple Integers Using a T-Chart
Problem: –5 + 12 + –7 + 3
Sorting the numbers into the chart:
- Positive column: 12, 3 → total = 15
- Negative column: –5, –7 → total = 12
Compare the two totals: Positive (15) is stronger than Negative (12) Subtract: 15 – 12 = 3 Final answer: +3
As problems become more complex, the T-chart still keeps everything organized and clear.
Common Mistakes Students Make (and How the T-Chart Fixes Them)
1. Mixing up signs
Students often forget which numbers are positive or negative. The T-chart forces proper sorting every time.
2. Trying to add signs instead of values
Many try to add numbers and signs together. The T-chart removes sign handling until the end.
3. Forgetting which side “wins”
The chart clearly shows which column has the higher total, eliminating confusion about the final sign.
4. Combining numbers in the wrong order
The T-chart encourages students to add positives separately and negatives separately—reducing errors dramatically.
Why Every Middle Schooler Should Learn the T-Chart Method
The T-chart builds strong number sense by making students think about integers logically rather than memorizing rules. Once they understand how positives and negatives interact visually, they develop a deep conceptual grasp of integer operations.
This understanding becomes incredibly important in pre-algebra topics such as:
- Solving equations with integers
- Working with coordinate planes
- Understanding slope
- Evaluating expressions
- Linear relationships
Because the T-chart method supports clear thinking and organization, students often experience fewer mistakes and faster improvement.
Final Thoughts: Adding Integers Is Easy with a T-Chart
The T-chart method is one of the most reliable, visual, and student-friendly strategies for adding integers. It replaces confusion with clarity and gives learners a repeatable process they can use on any problem—whether simple or complex. By sorting, organizing, comparing, and combining values the right way, students build real confidence in integer addition and develop the foundational skills they need for higher-level math.
With regular practice, adding integers using a T-chart becomes second nature, empowering students to approach math with a stronger mindset and deeper understanding.


Leave a comment
This site is protected by hCaptcha and the hCaptcha Privacy Policy and Terms of Service apply.